Besides rich telemetry that is collected by Application Insights modules transparently for your applications you also want to make your custom tracing and logging messages part of the overall correlated diagnostics data so you could have even better insights into what's happening in your applications. Application Insights provides consistent APIs for .NET, JavaScript, Java and Android, Objective-C and Swift that allow you to send your custom messages optionally bundled with properties and metrics. You can use these APIs on the server, desktop, native device apps and in the web client code.
Tracing
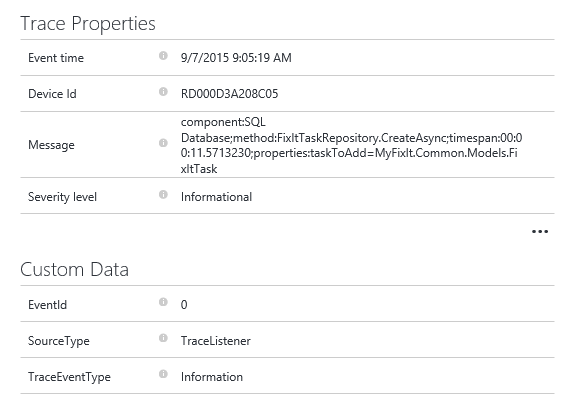
Just like the last time I'm going to be using the FixItApp sample application. It contains a simple Logger component that uses System.Diagnostics.Trace to log generic messages of various severity and also provides a way to trace performance of of data layer calls. The easiest way to make it send messages to Application Insights is to install an adapter package. There are adapters for popular logging solutions such as System.Diagnostics.Trace, NLog and Log4Net that have been provided by Microsoft. The adapter packages add proper hooks and you should see your messages in Application Insights. They are going to be marked as 'Trace' in the Search blade and will basically contain the message string that you format and a few pieces of contextual data such as severity level, event time and device Id:
internal class Logger : ILogger
{
    ...

    public void TraceApi(string componentName, string method, TimeSpan timespan, string properties)
    {
        string message = String.Concat("component:", componentName, ";method:", method,             ";timespan:", timespan.ToString(), ";properties:", properties);
        Trace.TraceInformation(message);
    }
}
But wouldn't it be nice if you could split the long formatted string into logical components and present them in a more structured way?
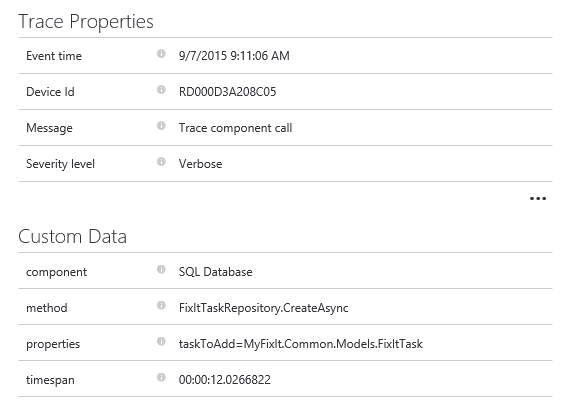
This is possible with Application Insight's native API:
internal class AiLogger : ILogger
{
    private readonly TelemetryClient telemetryClient = new TelemetryClient();

    ...

    public void TraceApi(string componentName, string method, TimeSpan timespan, string properties)
    {
        var telemetry = new TraceTelemetry("Trace component call", SeverityLevel.Verbose);
        telemetry.Properties.Add("component", componentName);
        telemetry.Properties.Add("method", method);
        telemetry.Properties.Add("timespan", timespan.ToString());

        if (!string.IsNullOrWhiteSpace(properties))
            telemetry.Properties.Add("properties", properties);

        telemetryClient.TrackTrace(telemetry);
    }
}
The key is to use TelemetryClient from Microsoft.ApplicationInsights NuGet package. It contains methods for generic tracing like the one shown above, as well as specialized methods to log exceptions, dependency calls, custom events and metrics.
Exception logging
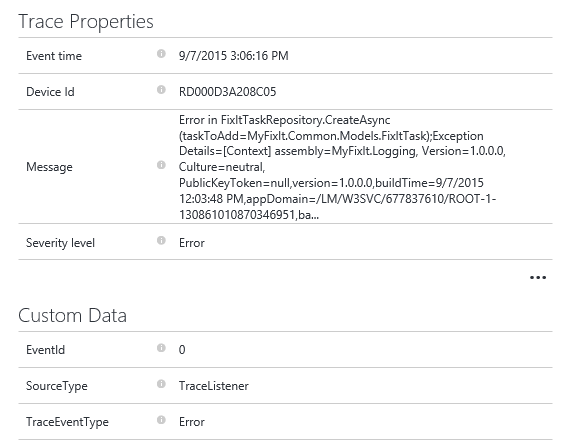
When you use the TraceListener adapter to log exceptions they will still look like long formatted strings:
internal class Logger : ILogger
{
    ...

    public void Error(Exception exception, string fmt, params object[] vars)
    {
        var msg = String.Format(fmt, vars);
        Trace.TraceError(string.Format(fmt, vars) +
            ";Exception Details={0}", ExceptionUtils.FormatException(exception, includeContext:true));
    }
}
But if you re-implement the tracing Error method using TelemetryClient and give the actual exception object like this:
internal class AiLogger : ILogger
{
    private readonly TelemetryClient telemetryClient = new TelemetryClient();

    ...

    public void Error(Exception exception, string fmt, params object[] vars)
    {
        var telemetry = new ExceptionTelemetry(exception);
        telemetry.Properties.Add("message", string.Format(fmt, vars));

        telemetryClient.TrackException(telemetry);
    }
}
You will get a much richer representation of the exception with additional contextual information, stack trace and custom data that you decide to include with your error message:
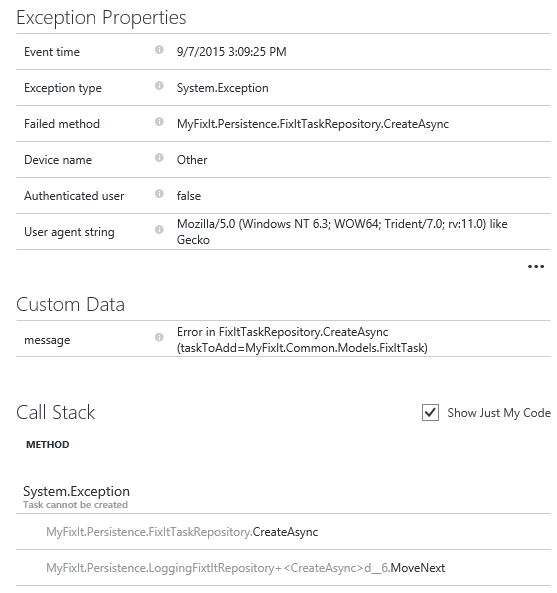
Check out a complete implementation of the FixItApp logger here.
In most cases you won't be wrapping each data layer call in a catch block in order to log errors. Instead you will let the errors propagate and log them with a global handler. Different technologies have their ways to implement global handlers and Application Insights documentation gives you examples for popular ones (see "Capturing exceptions and related diagnostic data" section).
Going further with custom event logging
So far we've been looking at generic tracing and exception logging. But what about logging of logical operations or events? For example, a user log in attempt or a task submission. We can look at these events from a web request perspective but they may not necessarily be triggered by web requests. And if they are, Application Insights will associate them with appropriate requests and we will be able to go from these business events down to dependency calls.
Consider a TaskService that is wrapped with a logging decorator that not only logs business calls as events but also measures their performance:
internal class LoggingTaskService : ITaskService
{
    private readonly ITaskService service;
    private readonly TelemetryClient telemetryClient = new TelemetryClient();

    public LoggingTaskService(ITaskService service)
    {
        this.service = service;
    }

    public async Task<List<FixItTask>> ListByCreatorAsync(string creator)
    {
        var stopWatch = new Stopwatch();
        stopWatch.Start();
        try
        {
            return await service.ListByCreatorAsync(creator);
        }
        finally
        {
            stopWatch.Stop();
            TrackEvent("ListByCreator", stopWatch.Elapsed);
        }
    }

    public async Task CreateAsync(FixItTask task, HttpPostedFileBase photo)
    {
        var stopWatch = new Stopwatch();
        stopWatch.Start();
        try
        {
            await service.CreateAsync(task, photo);
        }
        finally
        {
            stopWatch.Stop();

            var properties = new Dictionary<string, string>
                             {
                                 { "Title", task.Title },
                                 { "Owner", task.Owner }
                             };
            TrackEvent("Create", stopWatch.Elapsed, properties);
        }
    }

    private void TrackEvent(string eventName, TimeSpan elapsed, IDictionary<string, string> properties = null)
    {
        var telemetry = new EventTelemetry(eventName);
        telemetry.Metrics.Add("Elapsed", elapsed.TotalMilliseconds);

        if (properties != null)
        {
            foreach (var property in properties)
            {
                telemetry.Properties.Add(property.Key, property.Value);
            }
        }

        telemetryClient.TrackEvent(telemetry);
    }
}
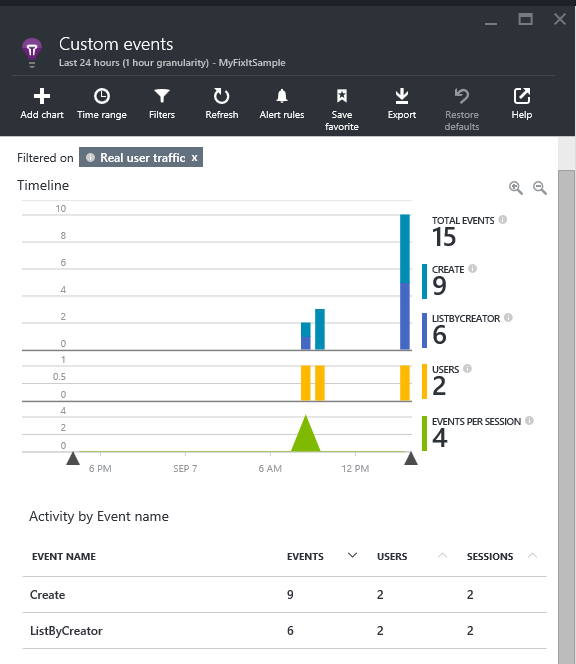
This time we use TrackEvent method of TelemetryClient and construct an EventTelemetry object. On the 'Custom events' blade we can see the events as they happened on the graph and we can drill down to the related telemetry:
LoggingTaskService includes arbitrary properties just like the AiLogger does in tracing calls. For example, when a task is submitted it includes its title and owner name. When an event instance is viewed this data is available in the Custom Data section:
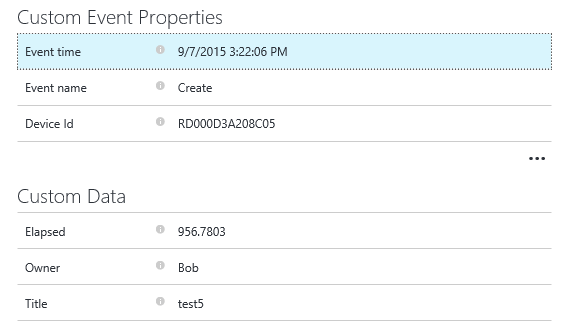
Note that although the Elapsed property is part of Custom Data it is actually added into a separate collection called Metrics:
telemetry.Metrics.Add("Elapsed", elapsed.TotalMilliseconds);
Metrics allow you to send numeric data such as time measurements or uploaded data size that you want to be associated with the custom event. Metrics can also be sent with TrackMetric method but they will not be associated with a particular event. For example you might want to monitor resource consumption or some custom state in regular intervals without connection to application events. All collected metrics can be viewed on the Metrics Explorer blade where you can add custom charts and define what metrics (performance counters, web server, custom ones collected with TrackEvent and TrackMetric calls, etc) they need to present.