Azure provides built-in capabilities for collecting diagnostic data of running applications. For example, in Web Apps we can setup server tracing for each HTTP request, persistence of detailed error pages and failed request tracing. We can also enable application logging and use System.Diagnostics.Trace or a popular logging framework to capture valuable information about our applications. We can setup persistence of all of this data to Azure storage so we could analyze it later. It all comes out of the box.
So why Application Insights?
It’s all about correlation and digestion of the captured data. An exception or a database call or a custom event they all happen as part of some sort of an operation. It can be a web request processing or a user performing an action on the client or a background task kicking in. Having a reference to such an operation and seeing what actually happened, what calls to external services or databases were made, what tracing messages and metrics were captured can be really insightful!
In this post I want to give you a taste of what Application Insights can do when you decide to add it your applications. I’m going to use a well known FixtItApp sample and you can find a slightly brushed up version of it on GitHub. It's already got Application Insights integrated so you can play with it right away.
Application Insights is not only applicable to web applications. It can be used with mobile apps running on devices and desktop application just as well.
Setting up
Data is collected to a ‘resource’. Think of it as container that keeps your data for a certain period of time and provides access to grouped and correlated events from a variety of angles. You can create a resource separately on the portal or it can be created together with you Web App. The second can be confusing because you see a resource that’s named like your app but it’s not really associated with it yet.
In your applications it’s all about adding appropriate NuGet packages. For example, Microsoft.ApplicationInsights.Web for web applications. It’s going to pull down the rest of the dependencies. Note that this is the package you add to ‘traditional’ pre ASP.NET 5 applications. But don’t worry, you can use Application Insights with ASP.NET 5 too.
It’s been over a year since a tooling was added to Visual Studio that allows you add Application Insights when you create a new application or add it to an existing application by right-clicking it and choosing ‘Add Application Insights Telemetry’ command.
Whatever the way you choose to add it the NuGet package install script will modify your web.config to add its HTTP module to the pipeline:
<httpModules>
  <add name="ApplicationInsightsWebTracking" type="Microsoft.ApplicationInsights.Web.ApplicationInsightsHttpModule, Microsoft.AI.Web" />
</httpModules>
The rest of its configuration is in ApplicationInsights.config that gets added to your application and needs to be deployed with it. In this file you can find configuration of various telemetry modules that are responsible for collecting events such as web request, dependency calls, performance counters, etc. It also can contain an instrumentation key for your resource:
<InstrumentationKey>404b3c7c-9b1b-429e-8771-7a9565f7af5e</InstrumentationKey>
This is how a resource gets actually associated with your app and this is how Application Insights components figure out where to send data to.
But guess what? I recommend you remove this from ApplicationInsights.config because you want diagnostics to be collected in different resources when you develop and test your application and when you run it in production. You want to make that part of your regular configuration. You can set the instrumentation key programmatically in your application initialization code then:
public class MvcApplication : HttpApplication
{
    protected void Application_Start()
    {
        AreaRegistration.RegisterAllAreas();

        FilterConfig.RegisterGlobalFilters(GlobalFilters.Filters);
        RouteConfig.RegisterRoutes(RouteTable.Routes);
        BundleConfig.RegisterBundles(BundleTable.Bundles);

        InitializeApplicationInsights();
    }

    private static void InitializeApplicationInsights()
    {
        TelemetryConfiguration.Active.InstrumentationKey =
            ConfigurationManager.AppSettings["ApplicationInsights.InstrumentationKey"];
    }
}
As with any configuration such as connection strings, encryption keys, etc. you shouldn’t put values that are to be used in production and test environments to web.config or any other configuration files that are going to be checked in to source control. Web Apps allow you to define configurations separately per deployment slots and it will overwrite values from the deployed web.config.
Tracing
FixItApp sample implements a logging component to capture repository calls and their metrics and any exceptions that can happen while calling external services. It uses System.Diagnostics.Trace and if you enable application logging in your Web App messages will be collected in local text files or Azure Storage.
But you want these custom messages to be part of Application Insights data so they can be viewed in relation to events and operations that happened in your application. Application Insights provides a TelemetryClient that you can use to send custom messages and your best choice is to create an implementation of your logging components that use it.
Alternatively, there are adapters for System.Diagnostics.Trace and other popular frameworks such as NLog and log4net. They can be used to quickly configure your custom logging to send messages to ApplicationInsights before you create dedicated components that will use TelemetryClient.
For the FixItApp logging component we’re going to install Microsoft.ApplicationInsights.TraceListener NuGet package that will add its listener to the diagnostics configuration:
<system.diagnostics>
  <trace autoflush="true" indentsize="0">
    <listeners>
      <add name="myAppInsightsListener"
           type="Microsoft.ApplicationInsights.TraceListener.ApplicationInsightsTraceListener,
                 Microsoft.ApplicationInsights.TraceListener" />
    </listeners>
  </trace>
</system.diagnostics>
In the upcoming post I’m going to show you benefits of switching to TelemetryClient but for the current demo let’s use the adapter.
Dependency tracking
Calls to external services such as databases, HTTP services, etc. are referred to as dependency calls in Application Insights. A lot of contextual information can be captured with these calls and they can be also measured. To fully enable Application Insights to track dependency calls you need to install Application Insights Status Monitor on your server. As explained in that article you want to both add Application Insights SDK to your application and install the Status Monitor to take advantage of the whole package.
If you deploy to Azure Web Apps you can enable dependency tracking by adding an extension to your app. On the new portal select Tools –> Extensions –> Add and choose Application Insights.
When running locally or in a VM or in cloud services you should use a stand alone installer.
Enable client side tracking
As I’ve mentioned above Application Insights is not just about your server components. It can be used on the client including mobile, desktop and web. Client side telemetry helps you better understand usage patterns and create a picture of your user base.
To enable client side tracking in web applications you need to grab a piece of JavaScript from the Application Insights resource you are targeting and include it with your pages (most likely in a layout file that’s reused across pages). You can find details of where to find the script here.
Show time!
Let's deploy FixItApp to Azure Web Apps and try to create a FixIt task. Once the task has been successfully created let's head to the Application Insights resource that has been associated with the app and see what data has been collected.
There are multiple ways (or I would say angles) that you can look at the data. On the main blade in the Overview section of the portal you can see grouped totals for server side data (number of server requests, server response time, number of failed requests) as well as client side data (browser page load time).
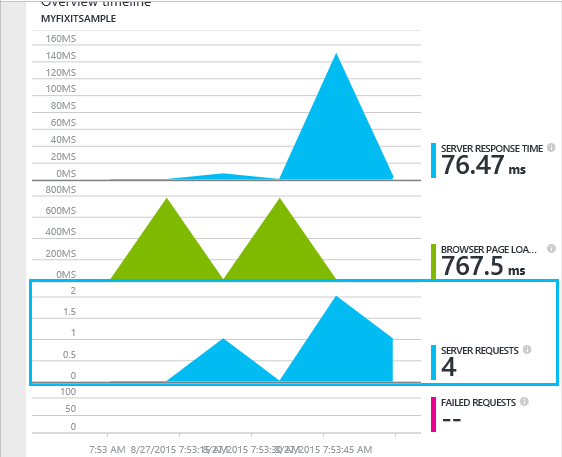
Server Side Events
Remember, these are correlated events that originated from the same user operation and you just look at them from different angles. If you drill down to Server Requests you can see there were 3 distinct steps of the operation:
- GET Task/Create to show the task from
- POST Task/Create when the form was submitted
- GET Task/Success to show the acknowledgment page
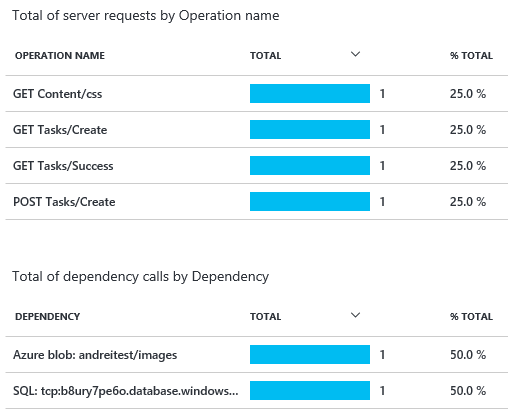
There were 2 dependency calls, one to the Azure SQL database to persist the task and another one to Azure Blob storage to upload an image.
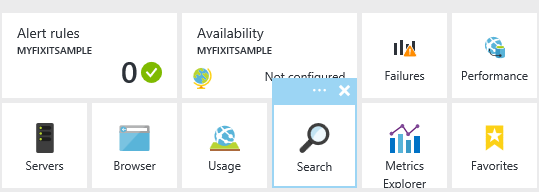
You can drill down further to any of these items but let's close the Server Requests blade and try the Search tool instead.
It will open up a chronological list of events:
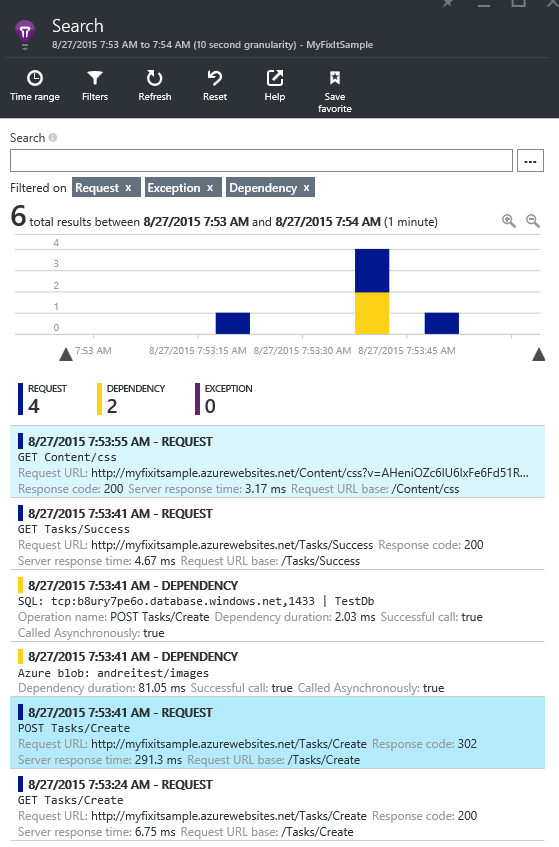
Just like on the main blade you can set a time filter to narrow down on the particular operation or a time period. The filter that you set on the main blade is automatically propagated to child blades such this one. On the Search blade each event is assigned a particular type and you can also set a filter for event types. On the screenshot above I am interested in server requests, dependency calls and exceptions.
Now from this list it's not obvious that these events belong to the same user operation but if you know the application you can kind of guess that there was a GET, then a POST, then two dependency calls and the final GET. But let's drill down on the POST request.
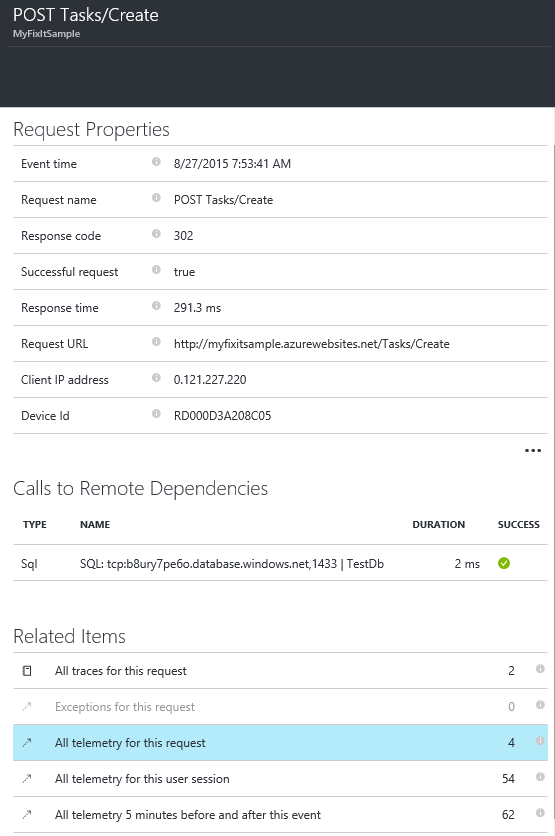
Lot's of info here! But why is there only one dependency call to the database? Let's check out Related Items that state there were 4 telemetry events associated with the request:
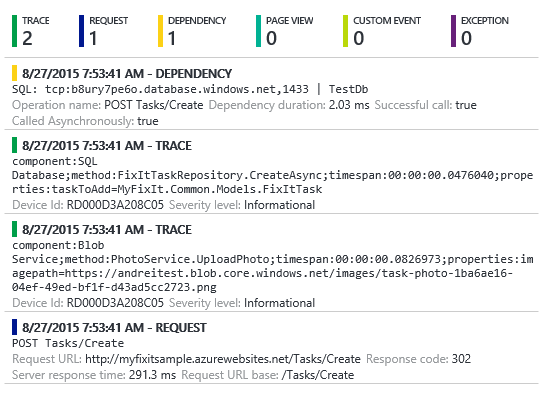
Indeed, no call to Azure Blob storage is mentioned here. We can see two custom traces coming from the Logger through the adapter. We haven't seen them on the Search blade because I filtered them out.
Why hasn't a call to Azure Blob storage been associated with the request is a good question that I currently don’t have an answer to. But for cases like this there is an option to show telemetry items for 5 minutes before and after the current event that should help you find missing pieces of the puzzle.
Let's drill down to the call to Azure Blob storage:
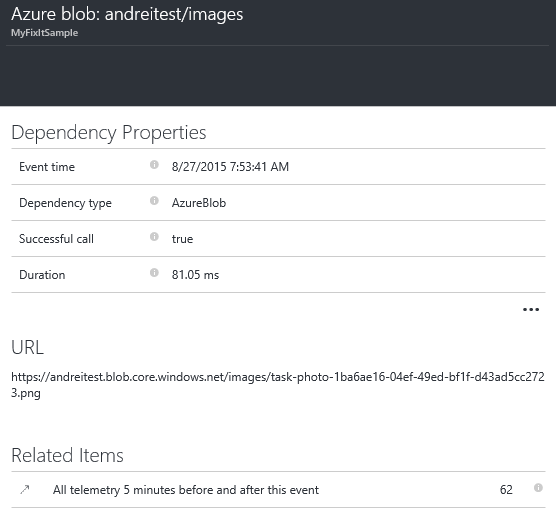
You can see the URL of the remote service, call status and duration. Pretty useful! Drilling down to the database call gives you the SQL statement that was issues:
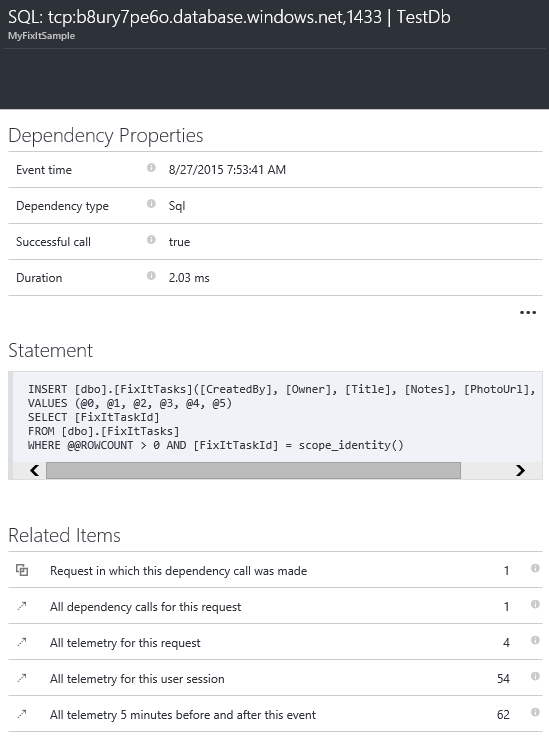
Again, using links in the Related Items section allows you to explore data that was either associated with an operation or happened in the same time period.
Client Side Events
Let's add page views to the event type filter on the Search blade:
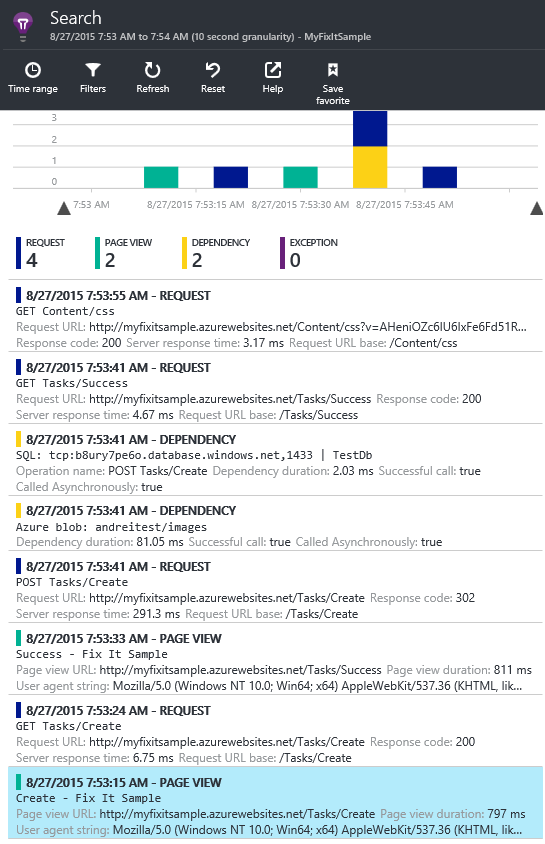
Alright, there are 2 page views as expected, one for the form and one for the successful status message. Page view events bring us quite a lot of interesting data too:
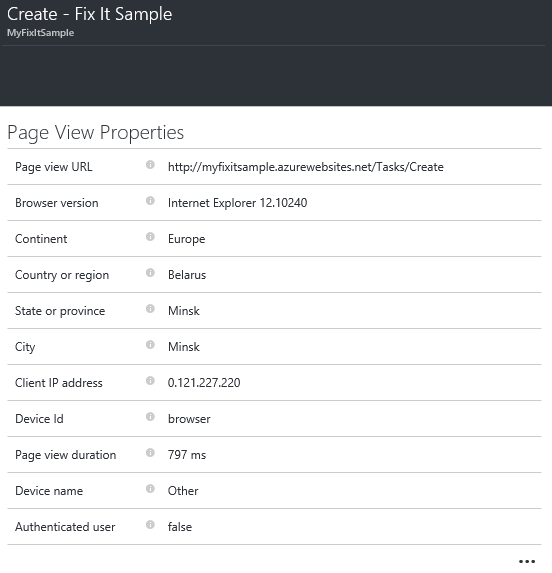
You can use this data to analyze how people are using your application. If you are familiar with tools like Google Analytics or Yandex Metrika you have an idea of what kind of knowledge you can draw from this data. In fact Application Insights provides you with the Usage blade that allows you to drill down from the client side collected data down to related server side events we saw earlier. This is something that cannot be achieved with client side only analytic tool.
Conclusion
My goal was not to cover everything but rather give you a sense of what's possible with Application Insights. Remember, it's not tied to ASP.NET or .NET applications in general. Please have a look at official documentation for further details on particular topics.